
Implementations
Implementations represents overview of a company identified hazard implementations in mCom ONE application.
Overview
Following diagram describes features available in implementations.
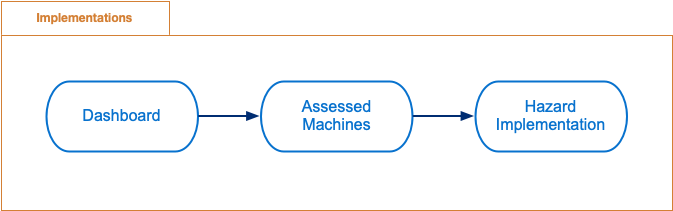
Implementations features
Dashboard - overview of company's hazard implementations state.
Assessed Machines - list of company's assessed machines and identified hazards
Hazard Implementation - hazard implementations management
Dashboard
Dashboard displays overview of company's hazard implementations state. By default it shows overview of all company's assets but it can be filtered down to specific machines using advanced filter.
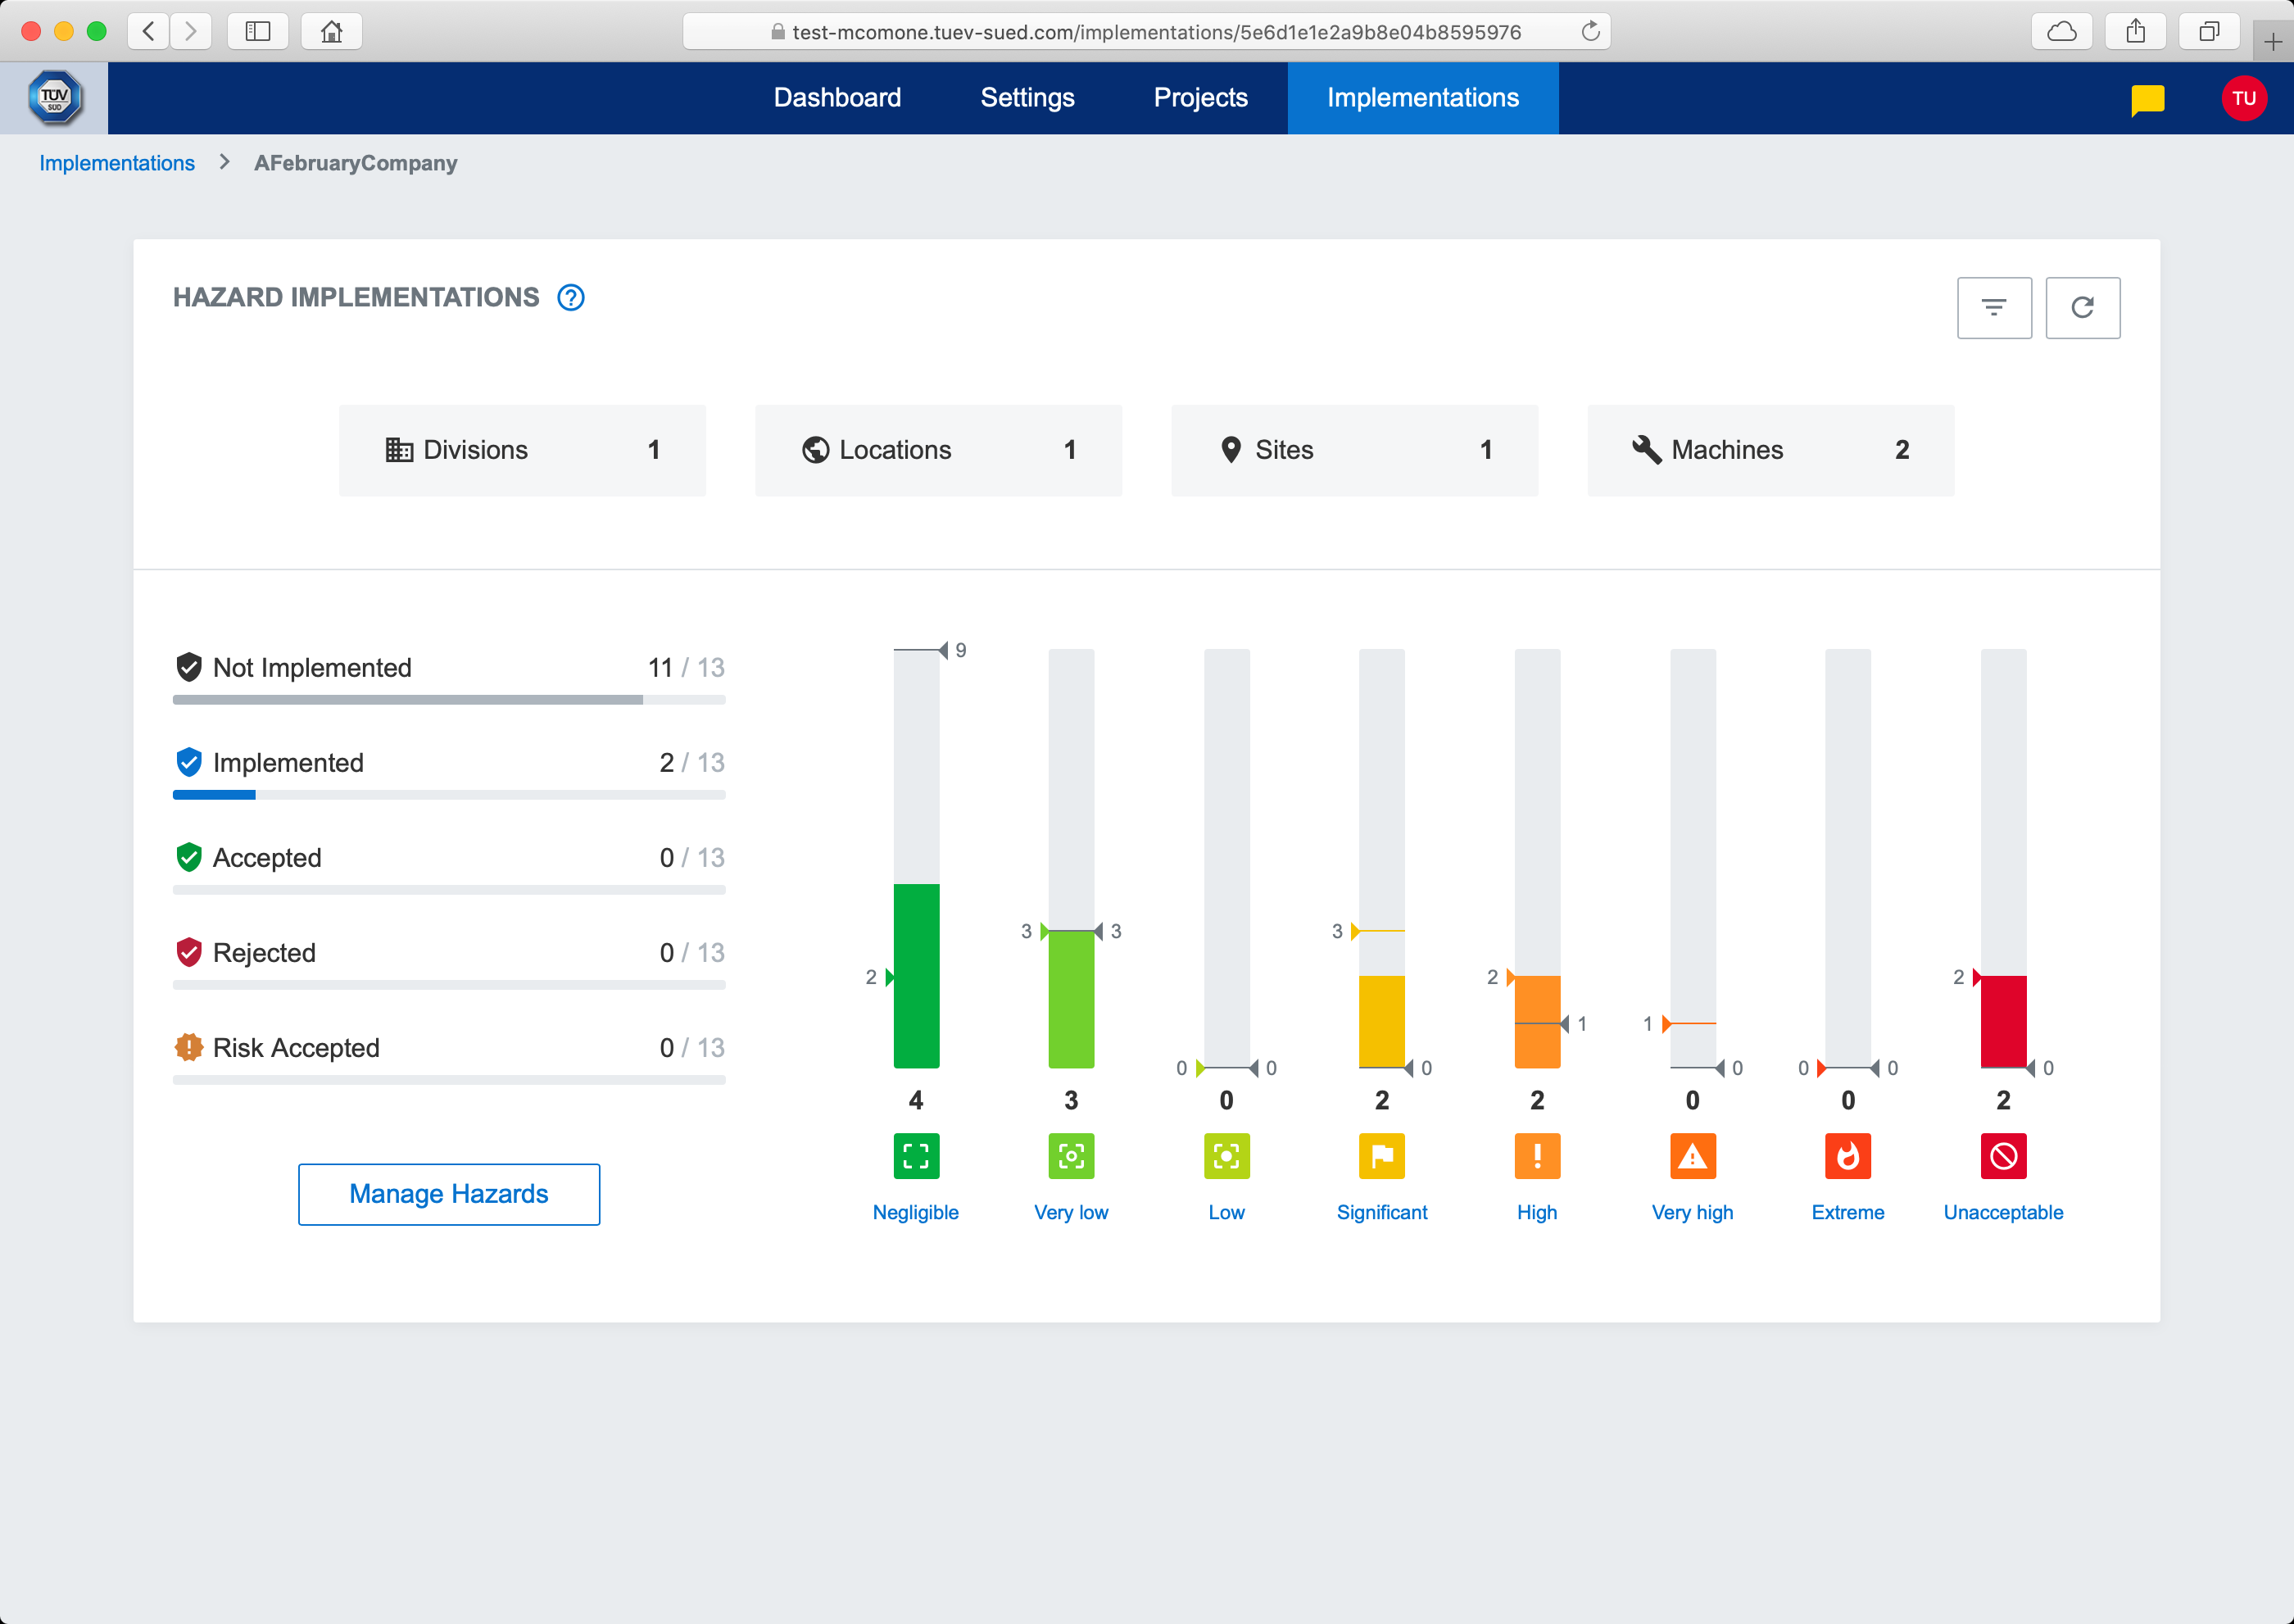
Implementations Dashboard
Top row of Dashboard screen shows counts of affected (or filtered) machines (and corresponding sites, locations and divisions).

Dashboard assets
Left side of Dashboard screen shows statistics over hazard implementations states.
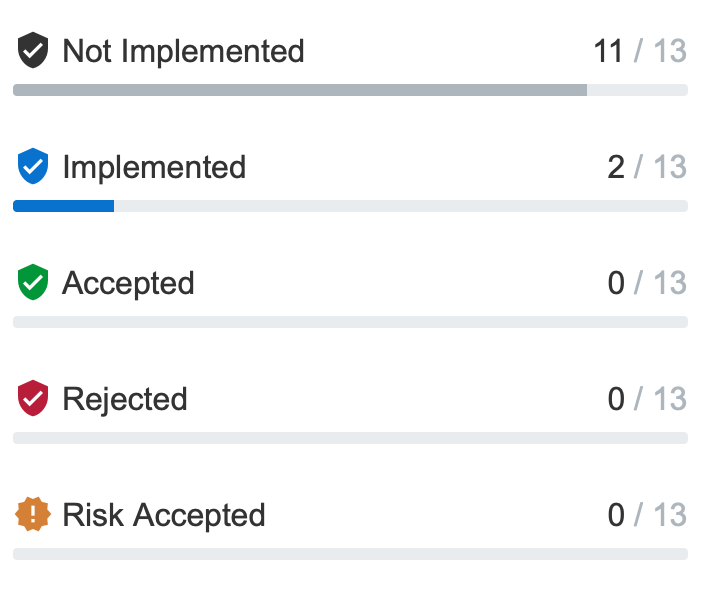
Hazard implementations states
Right side of Dashboard screen shows overview of identified hazards rating levels. Overview is based on current hazard implementation state, this means:
if hazard is not impemented yet, hazard rating level is displayed
if hazard is already implemented, control measure rating level is displayed.
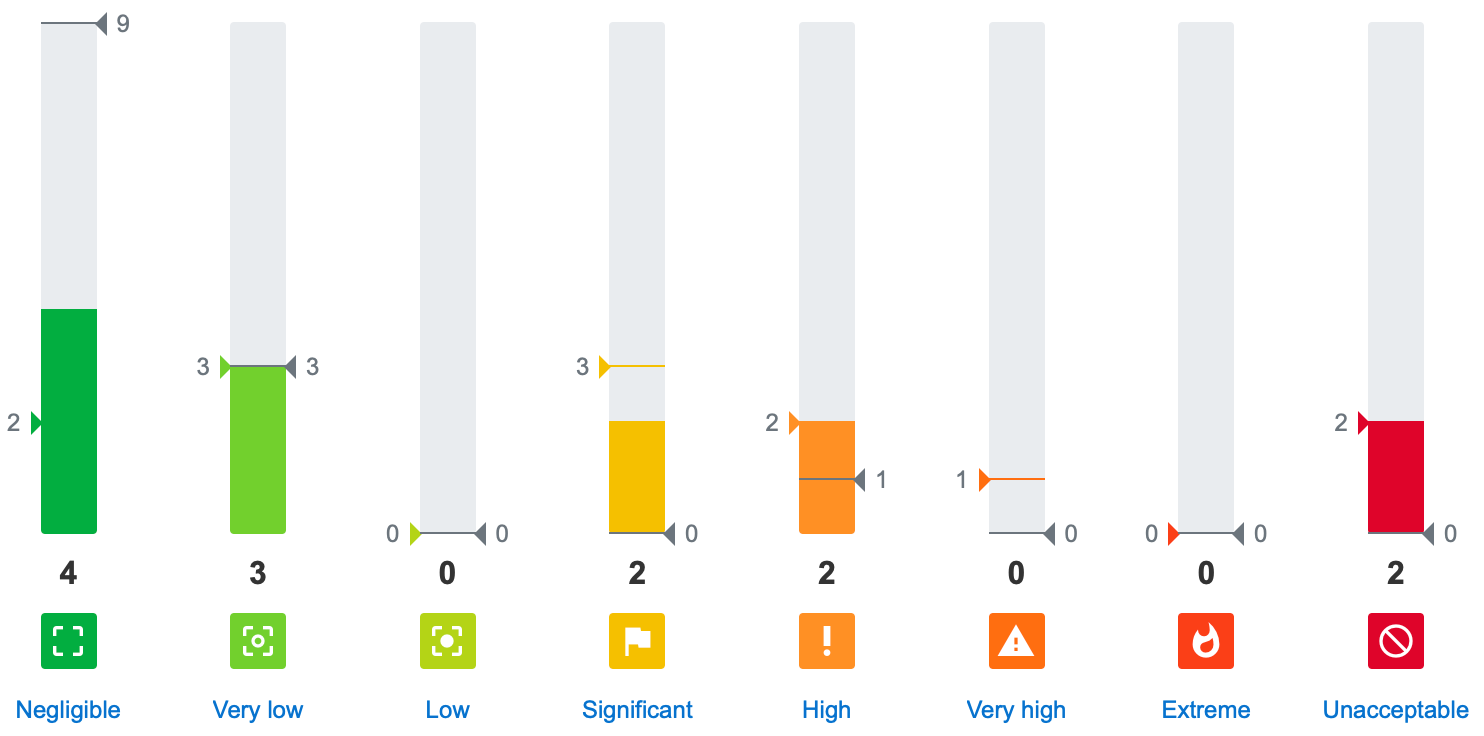
Identified hazards rating levels
Each bar in overview displays:
Target hazards count - gray arrow on right side of bar. Represents hazards count after all hazards are implementated and their control measure rating level is applied.
Original hazards count - color arrow on left side of bar. Represents hazards count before any hazards are implemented and their hazard rating level is applied.
Current hazards count - number below bar. Represents current hazards count, which can be mixed from already implemented and not implemented hazards.
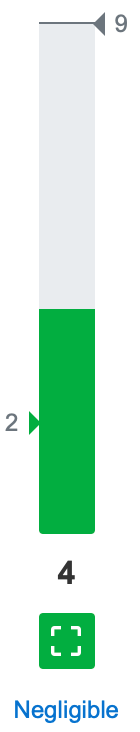
Identified hazards rating level bar
Following actions are available in dashboard screen:
Manage Hazards - activated using
Manage hazardsbuttonManage Hazards of specified rating level - activated by clicking on rating level name under bar in rating levels bar chart