
Project Overview
Project overview displays project details and project related statistics.
Overview
Following diagram describes features available in project overview.
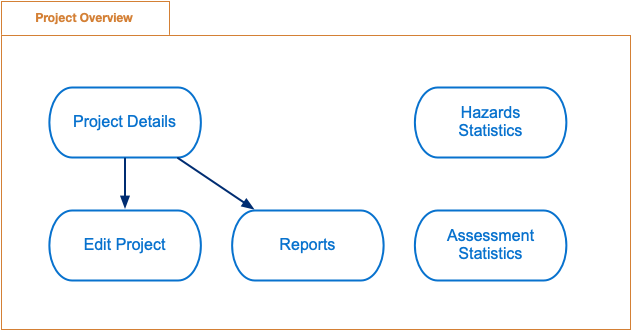
Project overview features
Project Details - displays project details and project statistics
Edit Project - updates existing project
Reports - generates reports
Assessment Statistics - displays checkpoints and control integrities statistics
Hazard Statistics - displays hazard statistics
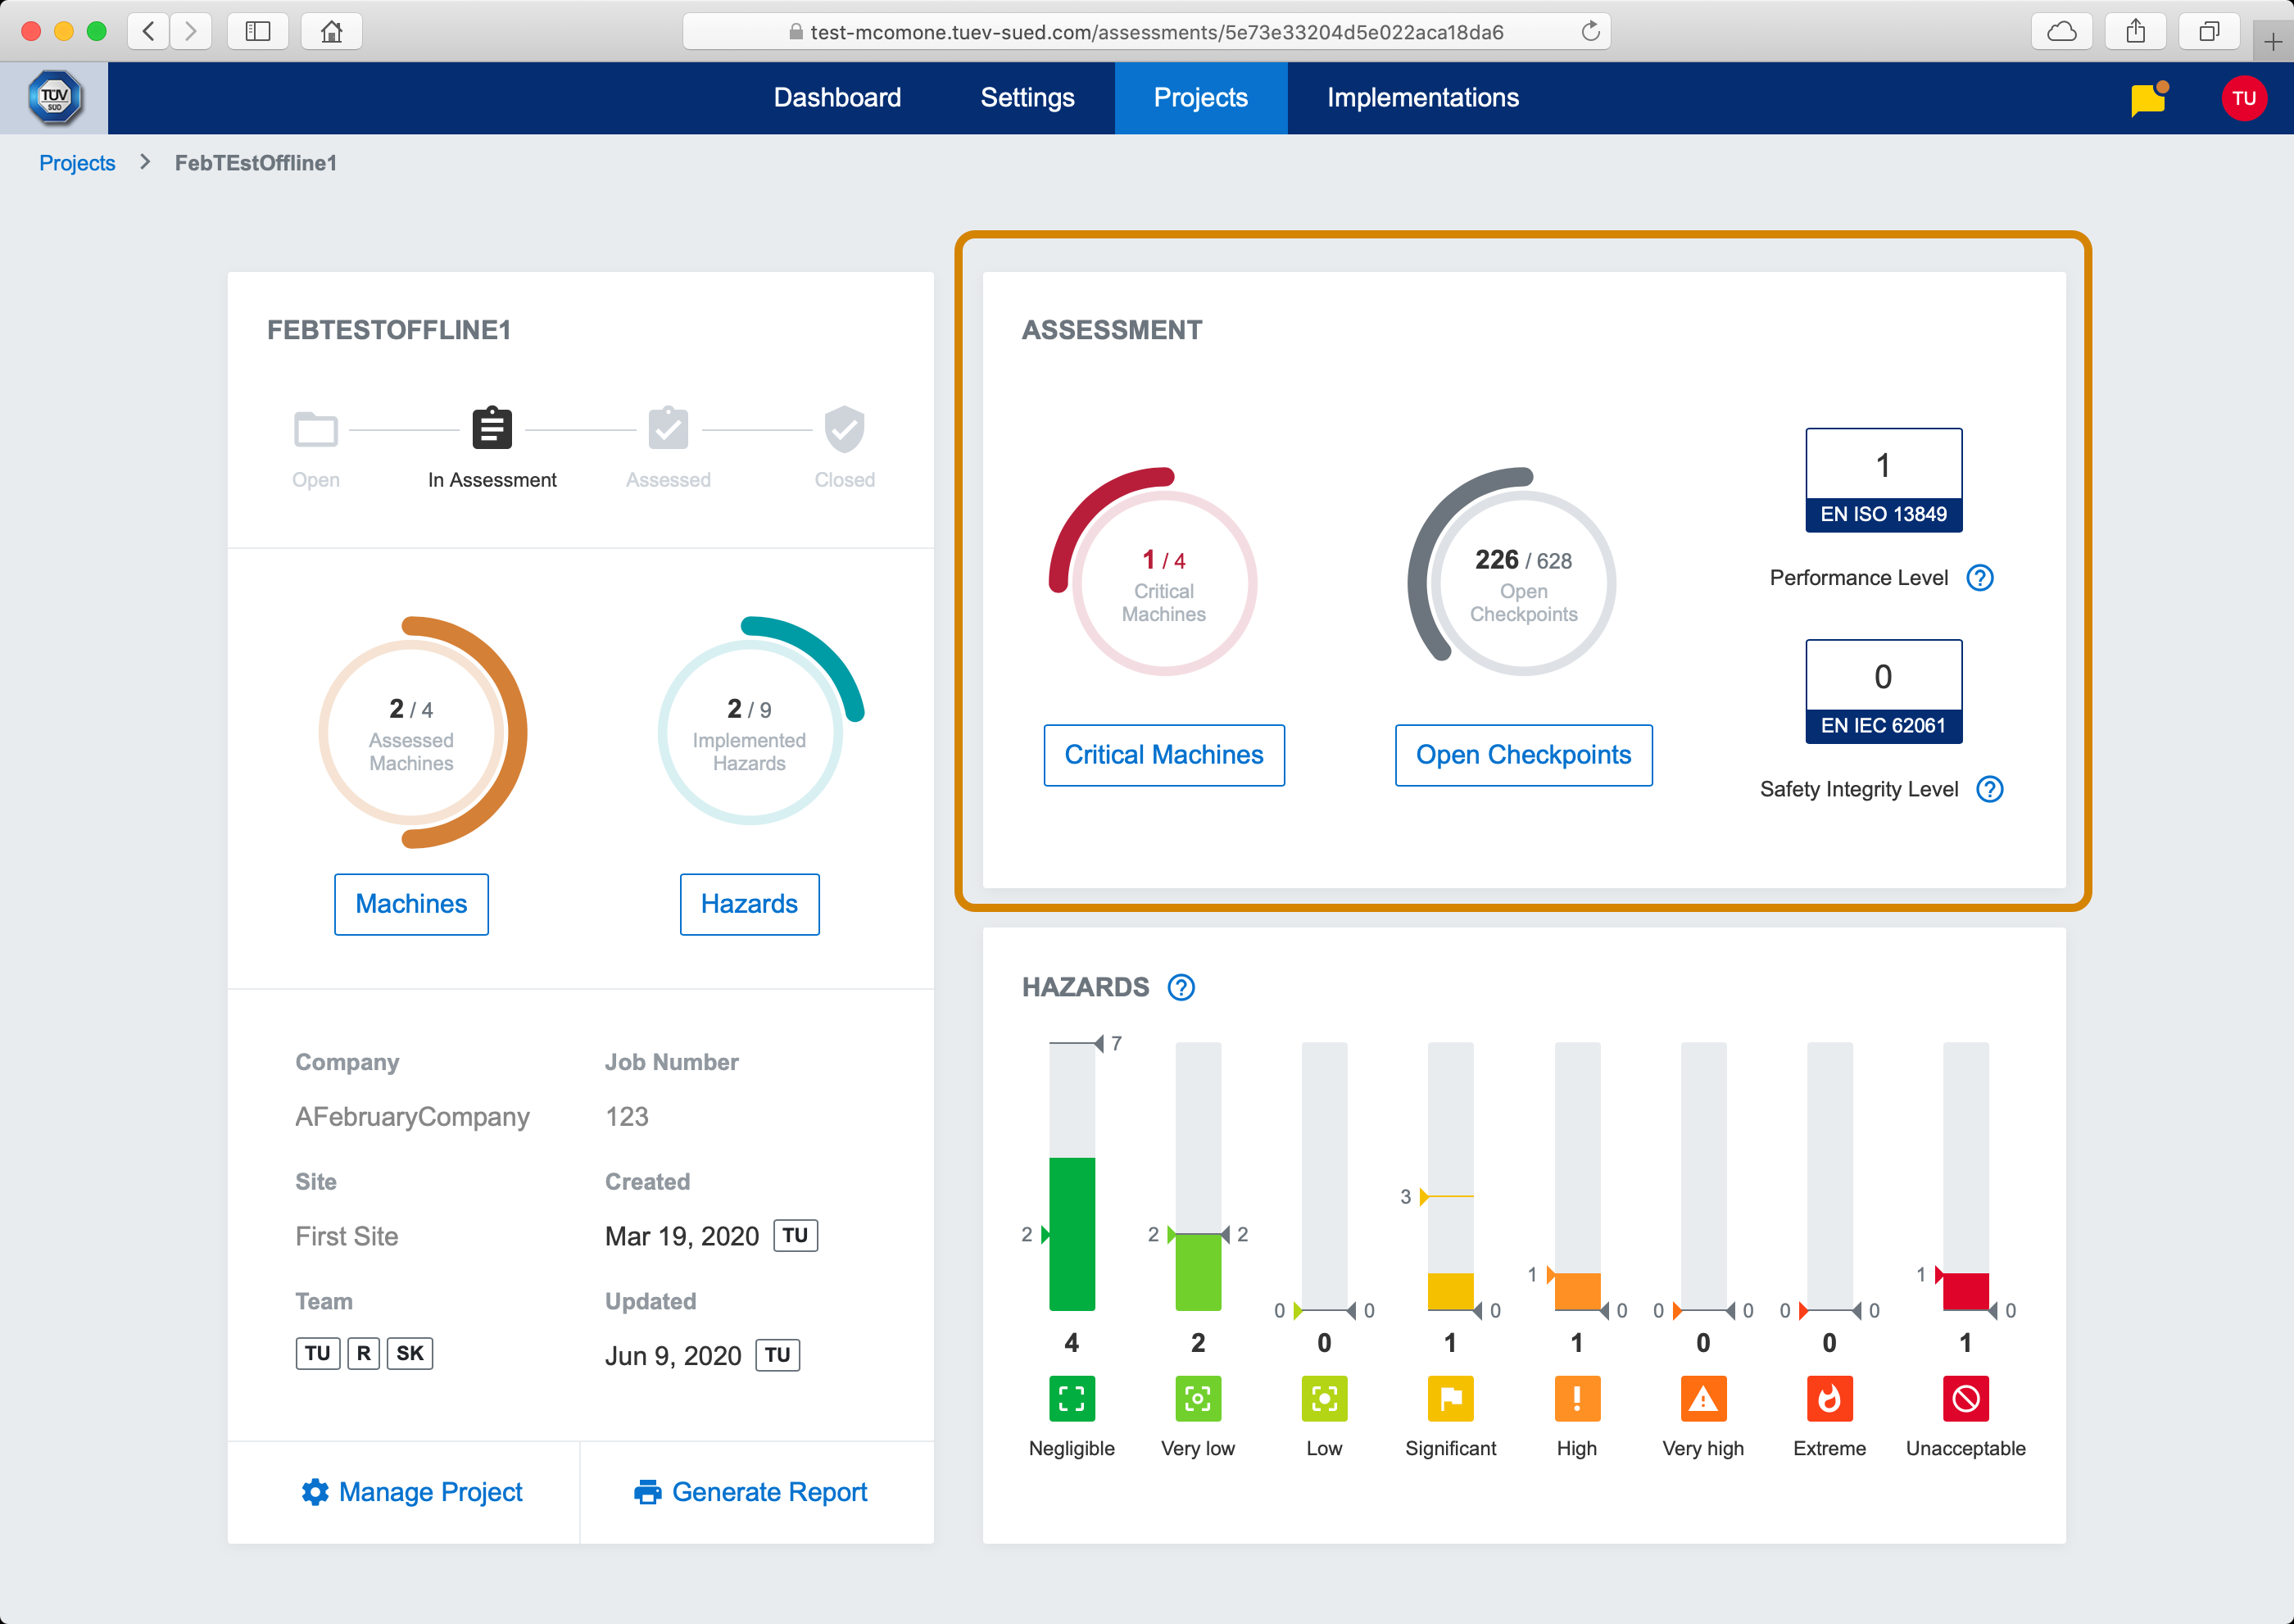
Project Details
This part of screen displays project state, project statistics and project details.

Project details
Project State
Top part of project details is current project state.

Current project state
Following are possible project states.
Open - project is open and no checkpoint in any project machine assessment was yet answered
In Assessment - some checkpoints (but not all) in project machine assessment were already answered
Assessed - all checkpoints in all project machine assessments are answered
Closed - project is marked as closed (finished) and cannot be modified
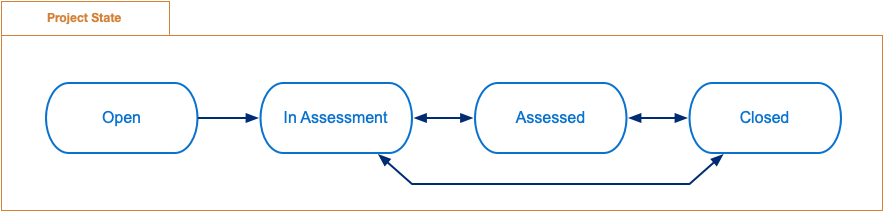
Possible project states
Project state is managed automatically in following cases:
OpentoIn AssessmentIn AssessmenttoAssessedAssessedtoIn Assessment
Project state is managed manually (from dropdown menu Manage Project) in following cases:
Assessed(orIn Assessment) toClosedClosedtoAssessed(orIn Assessment)
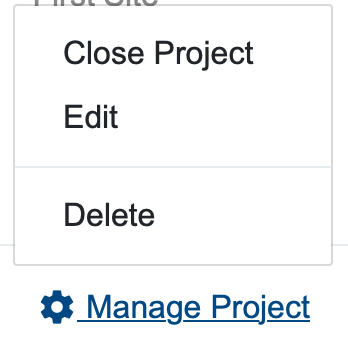
Manage project dropdown menu
Following actions are available:
Edit - will open Edit Project modal dialog.
Delete - will delete project and all associated project machines assessments.
Project Statistics
Middle part of project details are project statistics.
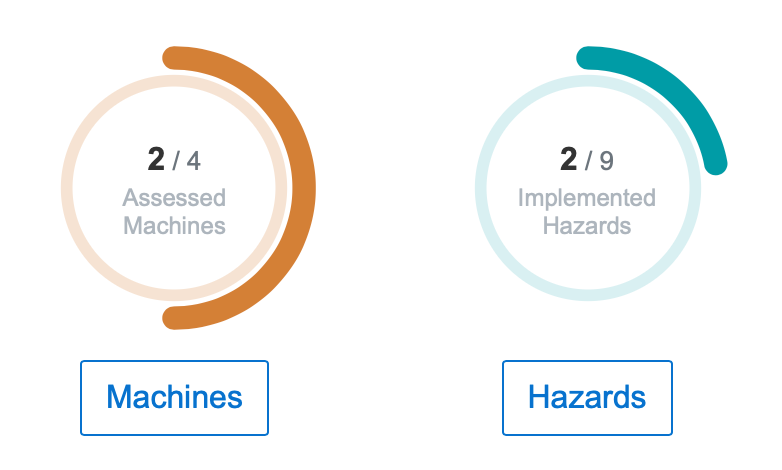
Project statistics
Assessed machines represents how many project machines are already assessed (i.e. all checkpoints in project mahcine assessment are already answered).
Implemented hazards represents how many of identified hazards from all project machines are already implemented.
Clicking on button bellow each circular progress bar will redirect to Project Machines.
Project Information
Bottom part of project details are basic project informations.
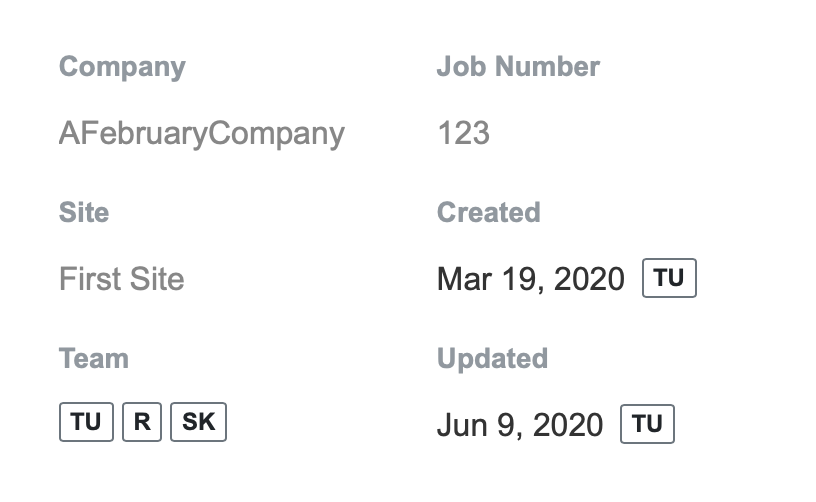
Project information
Edit Project
This modal screen is used to edit existing project.
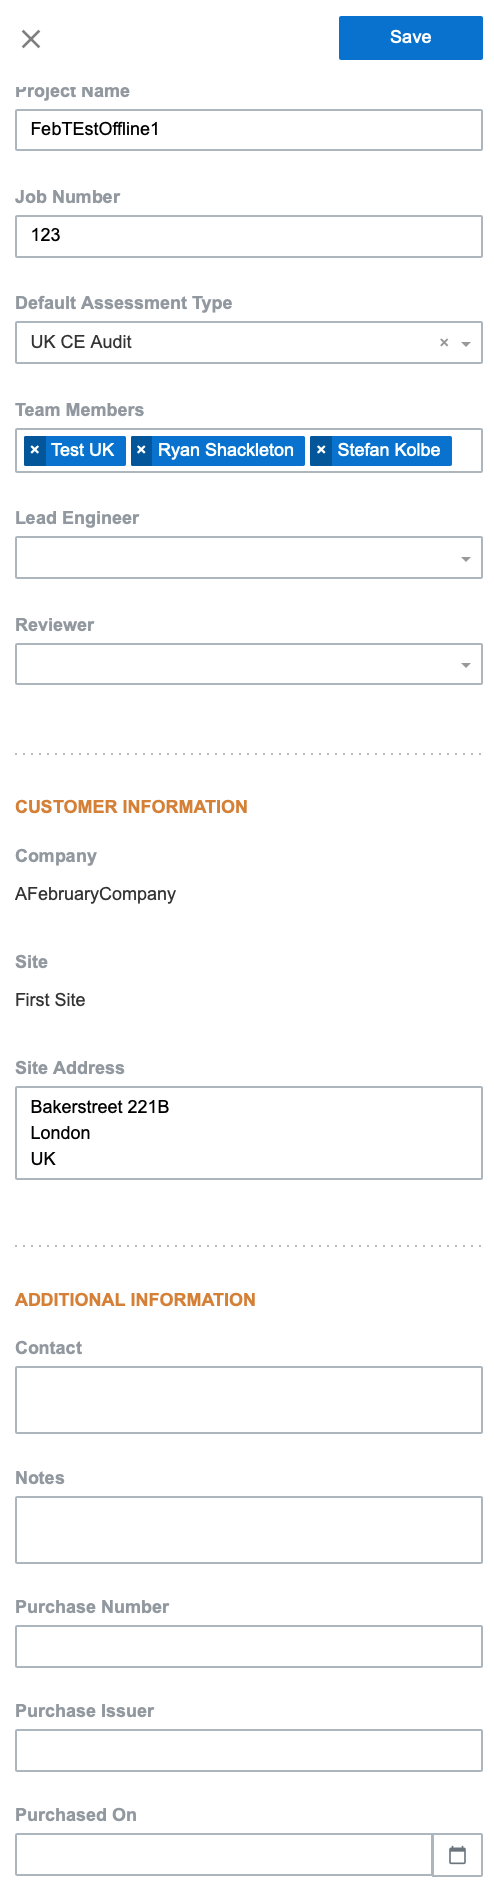
Edit Project
Reports
Reports functionality allows to generate various reports. There are 2 categories of reports:
Overview reports - overview reports are part of final assessment report (created manually outside of mCom ONE application)
Blank Checklist
Checklist
Control Integrity
Hazard List
Non Compliance
Project Machines
Project Machines Standards
Final reports - final assessment reports
Pre FES
Final FES
SEMI S2
Each report has its own report definition modal dialog which is opened from Generate Report dropdown menu.
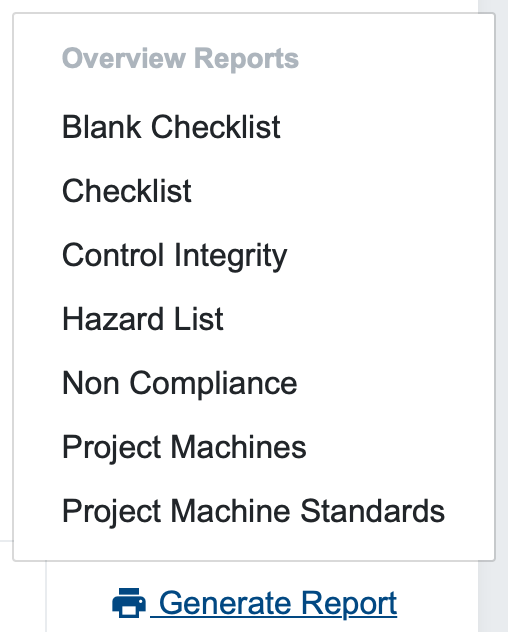
Generate report dropdown menu
Report definition modal dialogs are reports specific, but there are some common attributes:
Report Type - specifies report output (e.g.
PDF,Word, etc.) (if applicable)Output Type - specifies if output should be
Single file(i.e. every project machine in one document) orMultiple files(i.e. each project mahcine will be stored in separate document)
Assessment Statistics
This part of screen displays assessment statistics
Assessment statistics
Critical machines represents how many project machines from all project machines have at least one identified hazards from critical hazards group.
Open Checkpoints represents number of unanswered checkpoints in all project machines.
Clicking on button bellow each circular progress bar will redirect to Project Machines.
Performance Level and Safety Integrity Level represents number of corresponding Control Integrities in all project machines.
Hazard Statistics
This part of screen displays identified hazards statistics
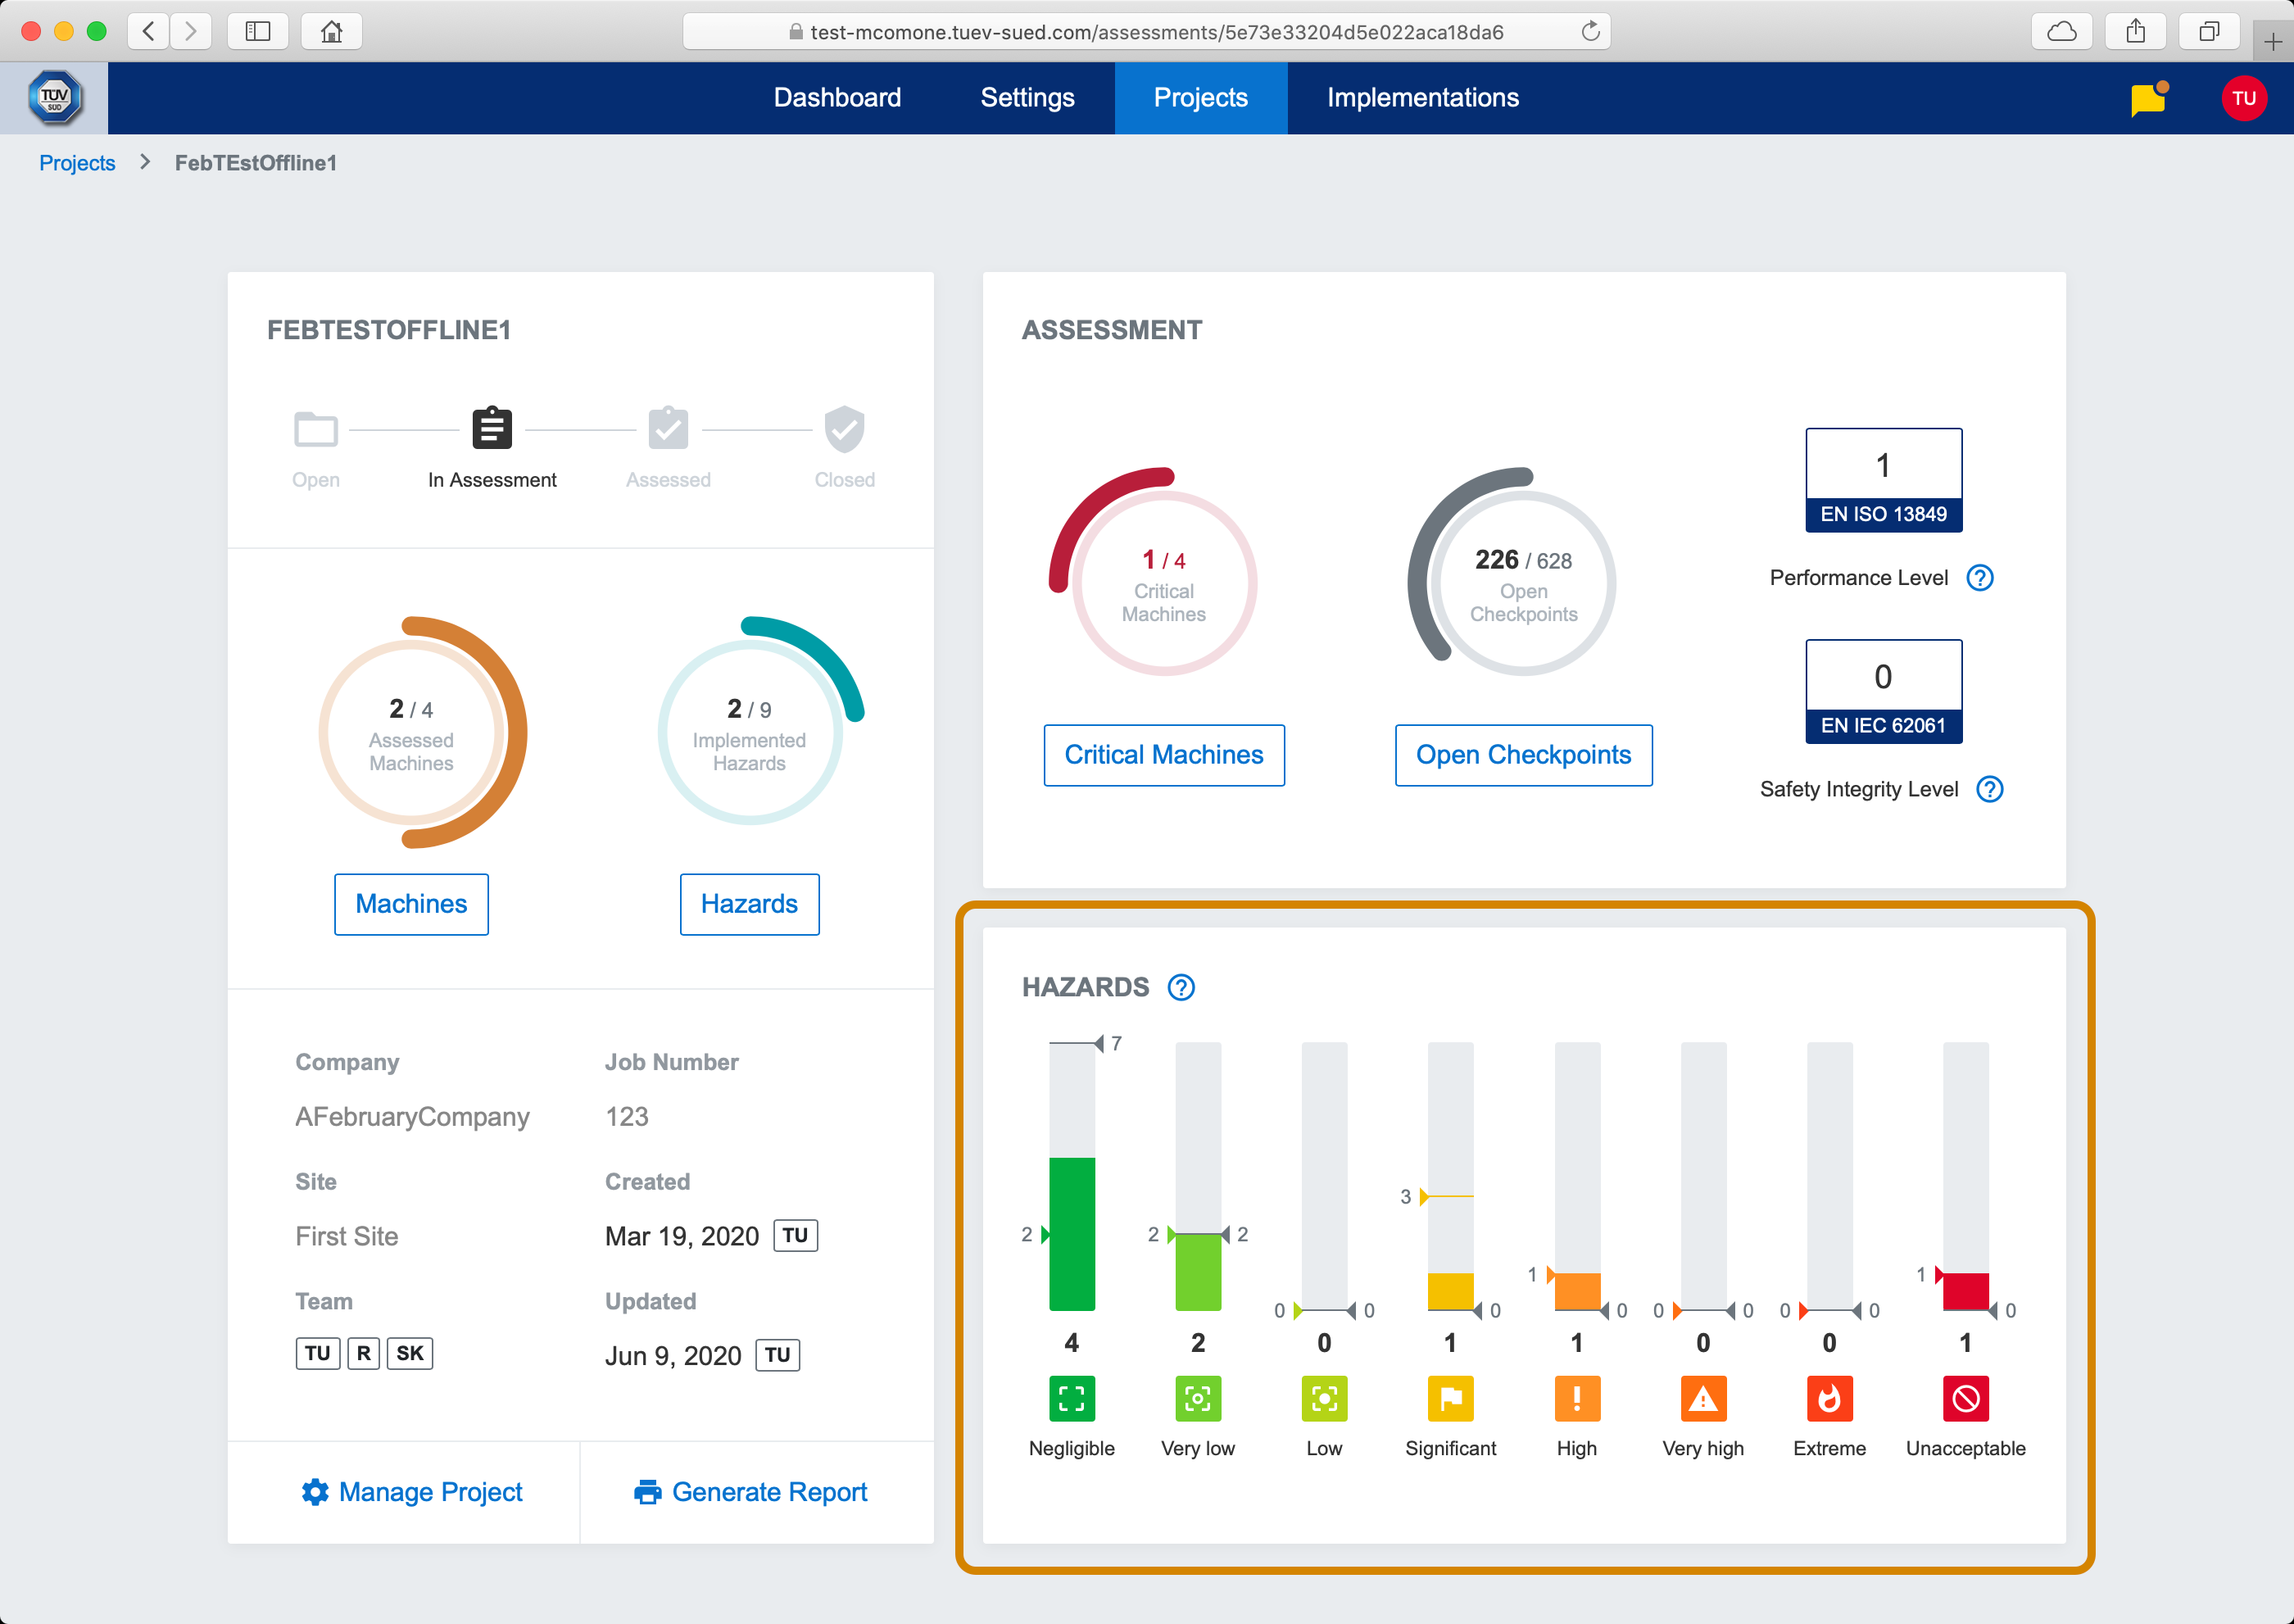
Identified hazards statistics
Overview is based on current hazard implementation state, this means:
if hazard is not impemented yet, hazard rating level is displayed
if hazard is already implemented, control measure rating level is displayed.
Each bar in overview displays:
Target hazards count - gray arrow on right side of bar. Represents hazards count after all hazards are implementated and their control measure rating level is applied.
Original hazards count - color arrow on left side of bar. Represents hazards count before any hazards are implemented and their hazard rating level is applied.
Current hazards count - number below bar. Represents current hazards count, which can be mixed from already implemented and not implemented hazards.

Identified hazards rating level bar